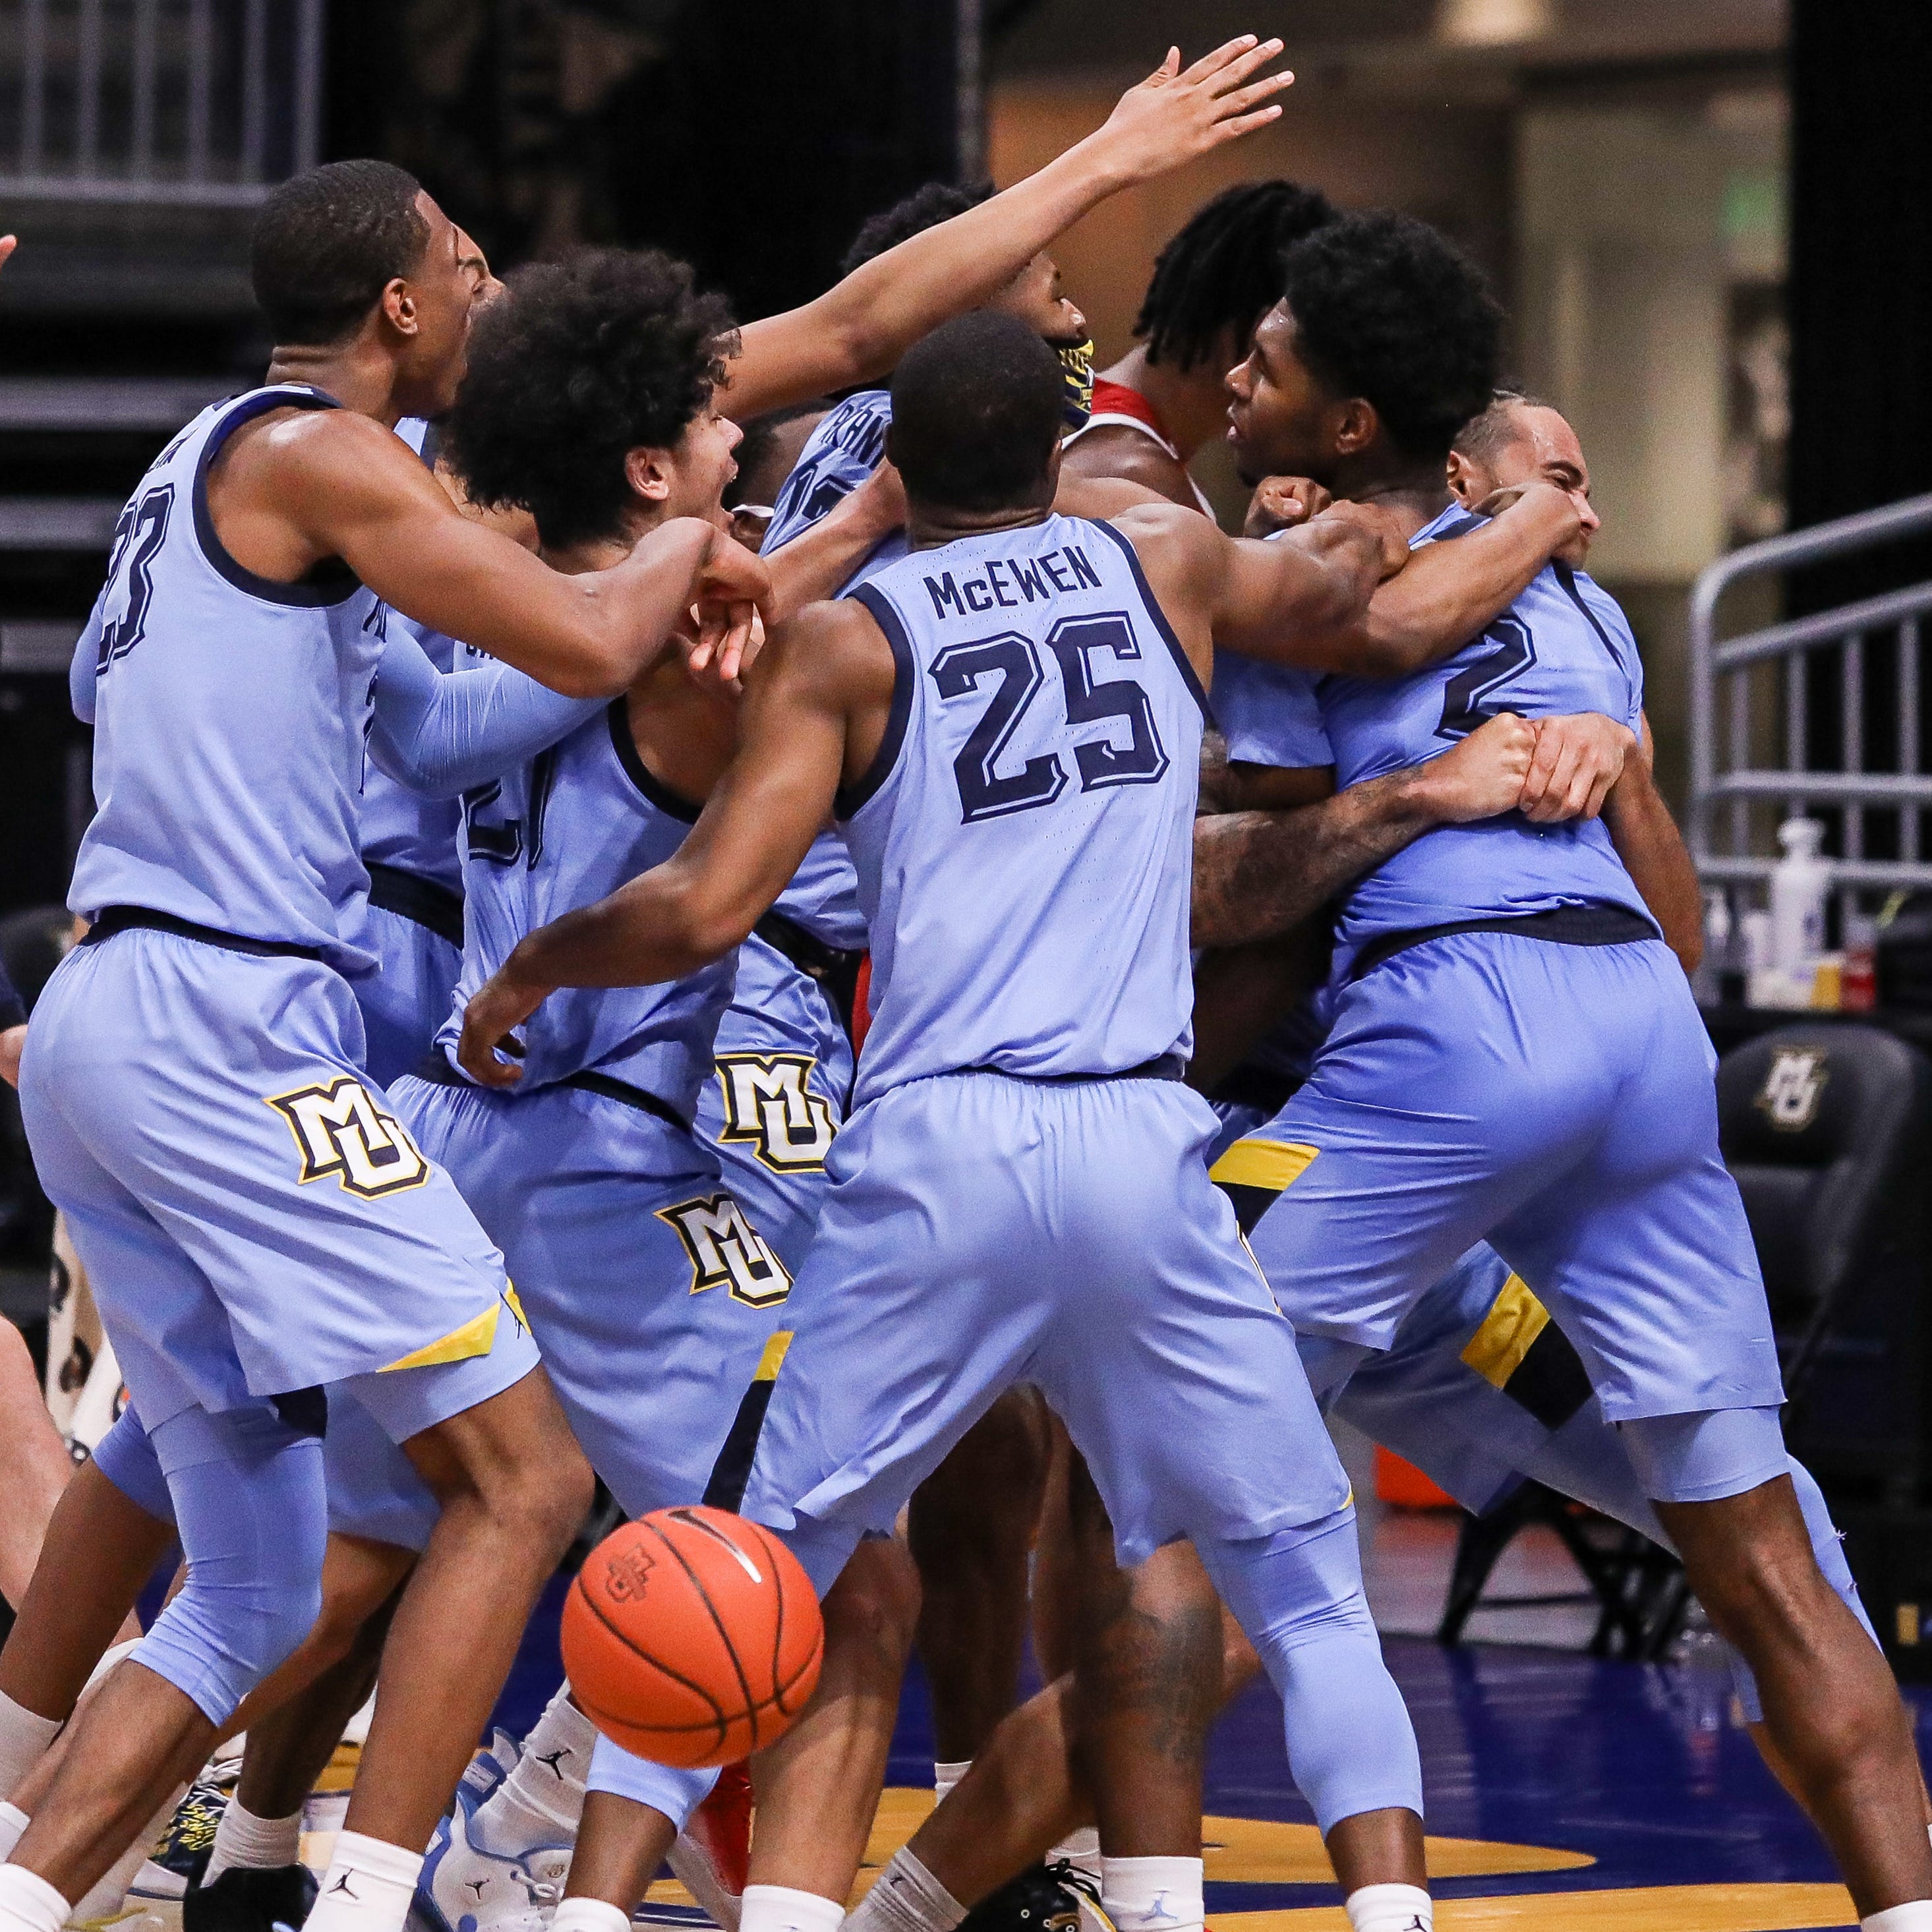
Marquette piles on Justin Lewis after his tip-in upset #4 Wisconsin
Photo courtesy of JSOnline.com
On Wednesday night, the Big East was reeling. After Providence fell to Alabama, the league had a 3-5 record against other high-major leagues, while losses by St. John's (BYU) and Seton Hall (Rhode Island) gave the league 3 losses to teams outside the Top-6. To make matters even more daunting, the league faced a brutal weekend slate in which Connecticut, Marquette, Seton Hall, Villanova, Seton Hall (again), DePaul, and Georgetown were all underdogs. If those games went according to the bookies, the Big East would have been staring at a 3-12 record against their fellow high-majors, which in a usual year would be disastrous, but in a COVID-shortened season with fewer opportunities to get such wins due to the truncated non-conference schedule, could've been...well, whatever is worse than disastrous.
Remember that last year, the Big East and college basketball on the whole lost massive shares of NCAA Tournament revenue. With units valued at over $280,000 each, the Big East, which Cracked Sidewalks projected to earn 7 NCAA bids last year, lost nearly two million dollars just on the basis of first round appearances, and with Creighton, Villanova, and Seton Hall all favored to at least reach a second weekend, likely lost out on millions more. To make up for that, the league needs a big season like never before.
In the six years since the Big East was reformed, the league has never had a losing record against the other high-majors. The following table shows not just the Big East's record against the other high-major leagues (ACC, Big 10, Big 12, Pac 12, SEC) but also their winning percentage in those games, the average number of losses per Big East member to teams Outside the Top-6 (O6 L/Team), the number of NCAA bids earned, and the percentage of league members earning a NCAA bid.
| BIG EAST |
W/L v P6 |
Win % |
O6 L/Team |
NCAA Bids |
Bid % |
| 2014 |
20-18 |
0.526 |
1.20 |
4 |
40.0% |
| 2015 |
23-16 |
0.590 |
1.40 |
6 |
60.0% |
| 2016 |
26-18 |
0.591 |
1.20 |
5 |
50.0% |
| 2017 |
27-18 |
0.600 |
1.10 |
7 |
70.0% |
| 2018 |
19-17 |
0.528 |
0.60 |
6 |
60.0% |
| 2019 |
21-20 |
0.512 |
1.00 |
4 |
40.0% |
For a league like the Big East, that has never had a season below .500 against the other high-majors, the idea of having a win percentage in the 0.200-0.300 range could be incredibly bad. Only twice since the Big East split off have high-major leagues had winning percentages against the other high-majors below 0.340; the 2016 SEC (0.306 W%) and the 2019 Pac-12 (0.212 W%) each earned 3 bids. However due to having fewer members, a Big East with such an abysmal record could've easily been looking at just 2 bids.
Why are these games so important? It's simple. The majority of the at-large bids go to teams from the Top-6 leagues, so those competitions are the primary determiner of league quality. Beat up on the other Top-6 leagues and you will be rewarded with more bids. Get beat up on, get fewer bids. The wild card is the number of losses to teams outside those top leagues.
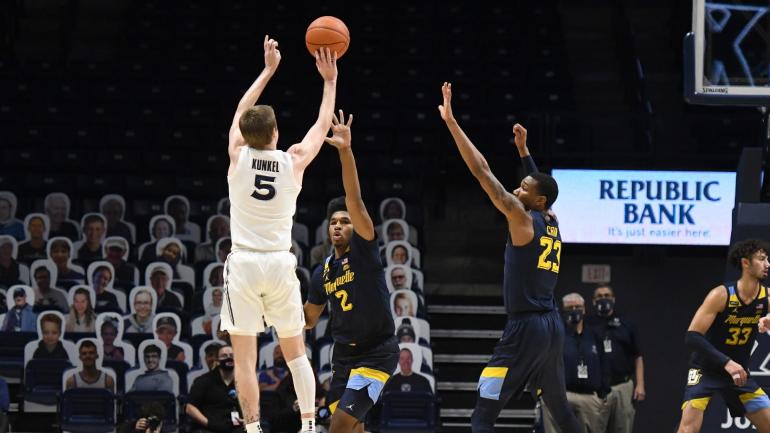
UConn started the turnaround with their win over USC. Marquette followed up on that with the league's then best win to date over #4 Wisconsin. Seton Hall dropped a game to Oregon, which was followed by Georgetown losing Sunday to West Virginia. The league had a successful Sunday overall, however, as Villanova got what might be the best win by any team of the season to date, beating Texas on the road while Seton Hall made up for their Friday loss, rallying from 19 down to beat Penn State in overtime. DePaul managed to remain undefeated, though that's only because their game at Iowa State was cancelled due to COVID protocols.
The league now sits at 7-7 against fellow high-major opponents with just 7 games left on the schedule. While there may be additional games added to make up for past cancellations, the simple reality is that there will be far fewer opportunities to get wins. Had the Big East gone 0-7 over the past weekend as expected, they would've been guaranteed a losing record in these games. Here's the current remaining high-major schedule:
Tuesday, December 8th: Creighton @ Kansas,
Wednesday, December 9th: Oklahoma @ Xavier, Providence @ TCU
Friday, December 11th: Nebraska @ Creighton, Marquette @ UCLA
Saturday, December 19th: Butler vs Indiana
Saturday, January 9th: Georgetown @ Syracuse
At this point, I think the league could probably hope for somewhere between three and seven bids, depending on remaining results. If they win 0-1 of the above games, expect 3 bids. If they win 2-3, expect 4 bids. If they win 4 games, expect 5 bids. If they win 6 games, expect 6 bids. And if they win all 7, they have a shot at 7 bids. This will depend on the number of losses outside the top-6, obviously. Beat the teams you're supposed to beat and the Selection Committee will likely be lenient, lose too many of those (Georgetown, DePaul, I'm looking at you) and it can impact the entire league.
The following table shows historical expectations based on results of all of the Top-6 leagues. I will include the data for all 6 of those leagues at the end of this in case anyone wants to check the math or look at historical performances, such as how the Big East and Big 12 have never had losing records against the rest of the Top-6, how the SEC has never had a winning such record, or which league has the worst single season since realignment settled. Here are those aforementioned Big East targets:
| Bids |
Bid % |
Low Win % |
High Win % |
Low Win O6 L |
High Win O6 L |
Mean Win% |
| 3 |
0.273 |
0.212 |
0.469 |
2.17 |
2.17 |
0.341 |
| 4 |
0.364 |
0.345 |
0.529 |
1.29 |
1.27 |
0.437 |
| 5 |
0.455 |
0.451 |
0.536* |
1.21 |
1.00 |
0.494 |
| 6 |
0.545 |
0.453 |
0.569 |
1.00 |
1.13 |
0.511 |
| 7 |
0.636 |
0.528 |
0.638 |
0.60 |
1.30 |
0.583 |
What does all this mean? Primarily that the Big East can still have a respectable showing come Selection Sunday. When I first started looking at this last week, I was really nervous. The performances of Marquette, Villanova, and Seton Hall's comeback in particular stand out as moments that could be the difference between 3 bids that would've been financially ruinous and more likely 5-6 bids that will give the league ample opportunities to help recoup some of the revenue lost in the non-existent 2020 NCAA Tournament.
It also highlights that in this season particularly, non-conference games are of significantly more importance. The reason the NCAA was so adamant they play non-conference games is because systems like kenpom, T-Rank, and the NET do not work without non-conference games. It isn't that they are less useful, it's that it is literally impossible for them to have accurate data if the leagues don't play each other. kenpom and T-Rank make projections based on what they think will happen and what happened last year. As the season goes on, that old data drops out and is replaced by current season data. In order for the systems to compare all 300+ NCAA teams, the only way to have a full basis for comparison is if the leagues play each other. If we only had league play, there would be no way to determine the difference between a 15-3 Winthrop from the Big South or 15-3 Baylor from the Big 12. While those divisions might seem obvious, what about comparing that same 15-3 Baylor team to 15-3 Kentucky? Both teams had identical conference records in high-major conferences, but we projected Baylor as a 1-seed and Kentucky as a 4-seed, and the only thing that makes that possible is the cross-pollenation of data between conferences.
Which brings us back to the importance of these games. When leagues are playing half as many non-conference games, and many of those are being cancelled due to a global pandemic, the ones that are played are far more important. In the past 6 years, the Big East has played an average of 40.8 high-major non-con games. This year that numbers is currently projected to be 22, meaning every one you are able to play has roughly twice as much importance for your league and a bad stretch, such as had the league begun those games 3-12 as was predicted on Thursday morning, could be catastrophic when Selection Sunday rolls around because instead of having 26 more games to make up the difference, you only have 7.
With that in mind, the entire league owes a collective debt of gratitude to their members for overcoming the odds and getting wins this past weekend. The league could really use 3-4 wins this week just to solidify their position as a top league and insure they are well-rewarded come Selection Sunday.
Below I am including league-by-league data charts matching the one from the Big East above. I'm doing this primarily because I think it's valuable data that others may be interested in. Also, before anyone complains, I am adamant on only including the Top-6 leagues as the high-majors. Sorry, but there are no accommodations for Gonzaga, or half the AAC, or anyone else. Quite simply, this data is here because the Top-6 leagues are competing with each other for NCAA bids. In an average year, the WCC expects between 1-3 bids. The AAC expects 2-4. No other league can reliably expect more than 2 bids. Even in their worst years, the ACC, Big East, Big 10, Big 12, Pac 12, and SEC expect 3-9 bids, depending on the number of members. They simply play in a different league, and despite other leagues having accomplished programs, they do not have the depth of quality that allows them to compete with the big boys. With that in mind, here's the additional data:
| ACC |
W/L v P6 |
Win % |
O6 L/Team |
NCAA Bids |
Bid % |
| 2014 |
25-27 |
0.481 |
1.67 |
6 |
40.0% |
| 2015 |
27-24 |
0.529 |
1.27 |
6 |
40.0% |
| 2016 |
31-28 |
0.525 |
0.93 |
7** |
46.7% |
| 2017 |
34-26 |
0.567 |
0.67 |
9 |
60.0% |
| 2018 |
29-22 |
0.569 |
1.13 |
8 |
53.3% |
| 2019 |
30-26 |
0.536 |
1.00 |
7 |
46.7% |
| BIG EAST |
W/L v P6 |
Win % |
O6 L/Team |
NCAA Bids |
Bid % |
| 2014 |
20-18 |
0.526 |
1.20 |
4 |
40.0% |
| 2015 |
23-16 |
0.590 |
1.40 |
6 |
60.0% |
| 2016 |
26-18 |
0.591 |
1.20 |
5 |
50.0% |
| 2017 |
27-18 |
0.600 |
1.10 |
7 |
70.0% |
| 2018 |
19-17 |
0.528 |
0.60 |
6 |
60.0% |
| 2019 |
21-20 |
0.512 |
1.00 |
4 |
40.0% |
| BIG 10 |
W/L v P6 |
Win % |
O6 L/Team |
NCAA Bids |
Bid % |
| 2014 |
25-24 |
0.510 |
0.67 |
6 |
50.0% |
| 2015 |
23-28 |
0.451 |
1.21 |
7 |
50.0% |
| 2016 |
26-26 |
0.500 |
1.64 |
7 |
50.0% |
| 2017 |
29-32 |
0.475 |
0.71 |
7 |
50.0% |
| 2018 |
21-31 |
0.404 |
1.00 |
4 |
28.6% |
| 2019 |
32-26 |
0.552 |
0.43 |
8 |
57.1% |
| BIG 12 |
W/L v P6 |
Win % |
O6 L/Team |
NCAA Bids |
Bid % |
| 2014 |
21-17 |
0.553 |
1.00 |
7 |
70.0% |
| 2015 |
23-16 |
0.590 |
0.50 |
7 |
70.0% |
| 2016 |
28-15 |
0.651 |
0.80 |
7 |
70.0% |
| 2017 |
23-17 |
0.575 |
0.90 |
6 |
60.0% |
| 2018 |
25-17 |
0.595 |
0.50 |
7 |
70.0% |
| 2019 |
30-17 |
0.638 |
1.30 |
6 |
60.0% |
| PAC 12 |
W/L v P6 |
Win % |
O6 L/Team |
NCAA Bids |
Bid % |
| 2014 |
19-17 |
0.528 |
1.25 |
6 |
50.0% |
| 2015 |
12-20 |
0.375 |
1.75 |
4 |
33.3% |
| 2016 |
15-15 |
0.500 |
1.50 |
7 |
58.3% |
| 2017 |
14-17 |
0.452 |
1.75 |
4 |
33.3% |
| 2018 |
15-17 |
0.469 |
2.17 |
3 |
25.0% |
| 2019 |
7-26 |
0.212 |
2.17 |
3 |
25.0% |
| SEC |
W/L v P6 |
Win % |
O6 L/Team |
NCAA Bids |
Bid % |
| 2014 |
20-27 |
0.426 |
1.79 |
3 |
21.4% |
| 2015 |
29-33 |
0.468 |
1.21 |
5 |
35.7% |
| 2016 |
19-43 |
0.306 |
1.07 |
3 |
21.4% |
| 2017 |
19-36 |
0.345 |
1.29 |
5 |
35.7% |
| 2018 |
24-29 |
0.453 |
1.00 |
8 |
57.1% |
| 2019 |
28-33 |
0.459 |
1.07 |
7 |
50.0% |
* The 2015-16 Big East also came close to matching this, but was considered a major outlier. That season had a close bid percentage, but the league had 3 teams with losing records and 2 teams that played virtually no one in non-conference and were thus left out. Because it was an extreme outlier due to those rare circumstances it was not included in this part of the data.
** The ACC would've likely had an eighth bid in 2015-16 had Louisville been eligible for the NCAA Tournament, but they self-sanctioned, resulting in 7 bids for the league.