
Photo by Mike de Sisti | Milwaukee Journal-Sentinel
In our last edition, Cracked Sidewalks looked at Marquette's history when it comes to the loss of volume points per game scoring and whether that has an impact on subsequent offensive efficiency. Because Marquette is losing four of the top seven points per game scorers, the obvious question we are trying to answer is "Who Will Score" in 2022-23.
Today, Cracked Sidewalks has gone back and looked at the entire coaching career of Shaka Smart. Due to relevance, we are also looking at the final seasons of the coaches that preceded him: Anthony Grant at VCU, Rick Barnes at Texas, and Steve Wojciechowski at Marquette. Using the same method as the last article, we are starting with the total number of points scored. We are then looking at the number of significant points lost, which were points scored by players that averaged 5.0 ppg or more. Using those two numbers, we could establish the percentage of significant points lost and match that up with the team's Adjusted Offensive Efficiency Rank as well as the Rank Change for the following year once they lost that percentage of points.
These seasons include Smart's entire career, with the "VCU/TX/MU" designations indicating the years before Coach Smart took over so we can see what impact his hiring had. We will again start with the raw data and then break it down into smaller bits to look at trends.
| Year | Total Pts | Sig Pts Lost | % Pts | AdjO Rank | Rk Change |
| 2021-22 | 2369 | 1329 | 56.1 | 64 | ?? |
| 2020-21 MU | 1883 | 1450 | 77.0 | 94 | 30 |
| 2020-21 | 2008 | 1069 | 53.2 | 28 | 2 |
| 2019-20 | 1989 | 0 | 0.0 | 153 | 125 |
| 2018-19 | 2628 | 1375 | 52.3 | 29 | -124 |
| 2017-18 | 2450 | 802 | 32.7 | 89 | 60 |
| 2016-17 | 2215 | 1084 | 48.9 | 177 | 88 |
| 2015-16 | 2355 | 1226 | 52.1 | 49 | -128 |
| 2014-15 TX | 2290 | 675 | 29.5 | 47 | -2 |
| 2014-15 | 2609 | 934 | 35.8 | 58 | 0 |
| 2013-14 | 2624 | 749 | 28.5 | 106 | 48 |
| 2012-13 | 2770 | 680 | 24.5 | 20 | -86 |
| 2011-12 | 2448 | 484 | 19.7 | 96 | 76 |
| 2010-11 | 2864 | 1671 | 58.3 | 47 | -39 |
| 2009-10 | 2737 | 598 | 21.8 | 28 | -19 |
| 2008-09 VCU | 2440 | 937 | 38.4 | 64 | 36 |
While Smart's 2021-22 team sees 56.1% of the significant scoring depart, his team last year had more to replace, as did his 2010-11 Final Four team, with nearly opposite results. Last year they replaced 77.0% of the scoring and saw the Adjusted Offensive Efficiency improve by 30 spots while in 2011 he lost 58.3% of the scoring and saw the Adjusted Offensive Efficiency decline by 39 spots. Let's group it out to see if there are any meaningful trends.
Major Point Losses: 60+%
| Year | Total Pts | Sig Pts Lost | % Pts | AdjO Rank | Rk Change |
| 2020-21 MU | 1883 | 1450 | 77.0 | 94 | 30 |
Compared to Marquette's own history, Smart has quite the short list. The only time he had to replace more than 60% of his scoring was last year when he took over Marquette from Steve Wojciechowski and saw a significant Offensive Efficiency improvement. Bear in mind the only number here that is actually Smart's responsibility is the "Rank Change" improvement. If this says anything, it might be that Smart is better at balancing classes and retaining players so that the only time he's ever been in position to replace so much was taking over a new program.
Moderate Point Losses: 40-59%
| Year | Total Pts | Sig Pts Lost | % Pts | AdjO Rank | Rk Change |
| 2010-11 | 2864 | 1671 | 58.3 | 47 | -39 |
| 2021-22 | 2369 | 1329 | 56.1 | 64 | ?? |
| 2020-21 | 2008 | 1069 | 53.2 | 28 | 2 |
| 2018-19 | 2628 | 1375 | 52.3 | 29 | -124 |
| 2015-16 | 2355 | 1226 | 52.1 | 49 | -128 |
| 2016-17 | 2215 | 1084 | 48.9 | 177 | 88 |
Hard to look at this and not see those two massive declines. The -124 and -128 are the two biggest drops in the 37 total seasons we reviewed between Smart's career and Marquette's history. And yet Smart's second greatest single-season improvement is also in this category. It's worth noting the 2 point improvement was made by Chris Beard as that was Smart's last season at Texas. The data here indicates Smart has at times struggled replacing significant scoring, though the small sample size and the 2017 outlier definitely shows it's not a definitive struggle.
Minor Point Losses: 20-39%
| Year | Total Pts | Sig Pts Lost | % Pts | AdjO Rank | Rk Change |
| 2008-09 VCU | 2440 | 937 | 38.4 | 64 | 36 |
| 2014-15 | 2609 | 934 | 35.8 | 58 | 0 |
| 2017-18 | 2450 | 802 | 32.7 | 89 | 60 |
| 2014-15 TX | 2290 | 675 | 29.5 | 47 | -2 |
| 2013-14 | 2624 | 749 | 28.5 | 106 | 48 |
| 2012-13 | 2770 | 680 | 24.5 | 20 | -86 |
| 2009-10 | 2737 | 598 | 21.8 | 28 | -19 |
This brings us back to the essential "nothing matters" conclusion. Three seasons where most of the scoring is retained end up in improvements, three end up in declines (including bizarrely the two that kept the most), and one had no change (though that was in a coaching change to Will Wade).
Minimal Point Losses: 0-19%
| Year | Total Pts | Sig Pts Lost | % Pts | AdjO Rank | Rk Change |
| 2011-12 | 2448 | 484 | 19.7 | 96 | 76 |
| 2019-20 | 1989 | 0 | 0.0 | 153 | 125 |
Another small sample size, but retaining 80+% of his scoring led to big improvements in the rare events when it's happened. The general takeaway seems to be that while losing scoring won't necessarily hurt you, retaining scoring seems likely to help. Though all one has to do to question that is look at the two entries immediately above these minimal loss results.
Summary
In total, there were 37 past seasons reviewed between Marquette's history and Smart's career. When looking at the most extreme outliers, there were four seasons classified as minimal loss (less than 20% of significant scoring lost) and four seasons classified as major loss (60% or greater significant scoring lost). With last year's 77% loss resulting in a 30-spot improvement with the transition from Wojciechowski to Smart being the outlier, the other seven results all resulted in improvement or decline as would be expected. So at the extremes, keeping scoring is good and losing scoring is bad.
The scatter plot below supports that. When you look at the seasons where the Percent of Points Lost (X-Axis) is below 20%, it always yields positive results in the AORtg Rank Change (Y-Axis). When you look at seasons where the Percent of Points Lost is greater than 60%, it usually yields negative results (2021-22 was the 77% outlier).
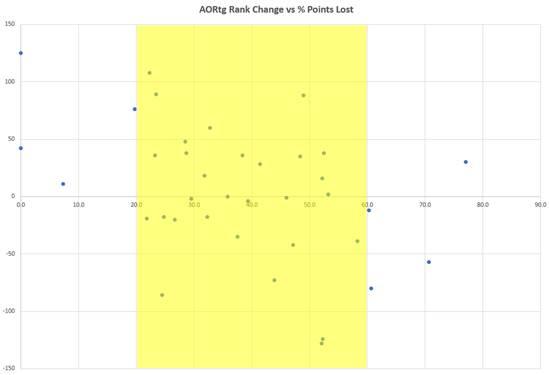
However in the minor and moderate ranges, highlighted yellow on the plot, the results were all over the
place. In 17 seasons of minor loss (20-39%), there were 8 teams that improved, 8
teams that declined, and one team that stayed the same, with the range
being anywhere from an 86 spot decline to a 108 spot improvement. In 12
seasons of moderate loss (40-59%), there were 6 teams that improved and 6 teams
that declined, with the range being anywhere from a 128 spot decline to
an 88 spot improvement.

Photo by Aaron Gash | AP Photo
Back to our trivia question from our preview article, Justin Lewis' 16.8 ppg is the most ever scored by a player on a Shaka Smart team. If anything, that should be reassuring to fans as typically, Smart simply doesn't have offenses that heavily revolve around one player. Replacing scoring is always going to be a team effort. Treveon Graham (16.2 ppg in 2014-15, 15.8 ppg in 2013-14, 15.1 ppg in 2012-13), Jamie Skeen (15.7 ppg in 2010-11), and Isaiah Taylor (15.0 ppg in 2015-16) are the only other players to reach the 15 ppg mark. In general, the scoring load for Smart is spread among a number of players rather than centered on one or two individual talents like we've sometimes seen at Marquette in recent years.
If there's any takeaway, it's that when you lose between 20-60% of your scoring, there's virtually no correlation between an offensive efficiency improvement or decline. Statistically speaking, replacing scoring is not something fans should get worked up about.

No comments:
Post a Comment