To help out with the summer doldrums, here is one way of looking at the relative contributions of each player on the team during 2010-2011. We'll start with the initial breakdown and then go through additional details.
2011 Net Points Contributions
Net points is one way of looking at the contributions of each player on the team. It is based on the idea that over the course of the season, a team wins by a number of points, and the credit for those points can be divided up among individual players. In other words, it allows a way to determine which players were most responsible for MU's total margin of victory. Note that this is a full-season view and not game by game (that would have been a lot more work).
The first three names on the list are not a surprise. Nor is it a surprise that they comprise a significant percentage of the net points. There is a common theory that the majority of a team's positive contributions come from 2-3 players.
It's also not a surprise that some players are negative. What does it mean to be negative? It means that, over the course of the season, their contributions on the court were an impediment to the winning margin. Keep in mind that being considered a "net-negative" player does not mean that player is bad; just that other players were more responsible for success. Not every player is a net positive contributor. What is a surprise is some of the players that showed up as negative. More on that in a bit.
Finally, net points are clearly an approximation. Net points is just one way of trying to consider the impacts of each player. If you're not comfortable with that, then stop reading now. There are other ways to calculate a player's net value, or you may just prefer to avoid stats altogether. Also, net points are not really helpful without some context, such as....
Usage and Net Points
This chart re-orders net points based on overall usage. It helps highlight some of that additional context. For example, Robert Frozena was about net-neutral, but his usage was effectively zero. Jamail Jones and Reggie Smith were both not very effective in limited usage.
Davante Gardner and Joe Fulce were both net-positive players, but role players. Joe was obviously limited by injuries and Gardner was limited by conditioning and/or defense. There is also the question of the net-negative impact of players that had a higher usage, such as Buycks, Blue, Cadougan, and Otule. Also, Butler was phenomenally productive in limited usage.
Offensive Rating and Net Points Besides usage, Offensive Rating also helps highlight why some players are net positive or net negative. Fulce and Gardner have great offensive ratings, which explains the net positive contributions in limited usage. The offensive rating demonstrates the difference between Crowder's net points contributions in 14% usage vs DJO's net points contributions in 19% usage.
This also helps demonstrate why Cadougan and Blue show up as net-negative contributors. Simply put, their offensive efficiencies were poor... well below the team average. However, this chart does not explain why Cadougan has a higher offensive rating but a worse net points contribution than Vander. To understand that, one needs to look at defensive rating.
Defensive Rating and Net Points
Defensive Rating is difficult to calculate. Most don't even bother, primarily because it's really just an approximation. The box scores don't show the value of a player who limits their man from getting the ball. They also do not show the times when a player guards an opponent and forces a missed shot. What Defensive Rating does do is take the team's defensive efficiency and then adjusts for defensive stats such as steals, blocks, and defensive rebounds. Personally, I don't mind doing the defensive rating because it helps fill in more of the picture, but one needs to be aware of the shortcomings.
In this view, Vander's defense is better than Cadougan's, and Otule's defense is better than Gardner's. Both concepts pass the conventional wisdom test. Vander is probably understated in his defensive rating, but his defense would need to be a rating of 86 to move to the net positive category. (correspondingly, Gardner's defensive rating would need to be 128 for him to move to a net-negative contributor). Crowder gets credit for defensive rebounds but not defensive positioning. His rating is probably overstated a bit.
Summary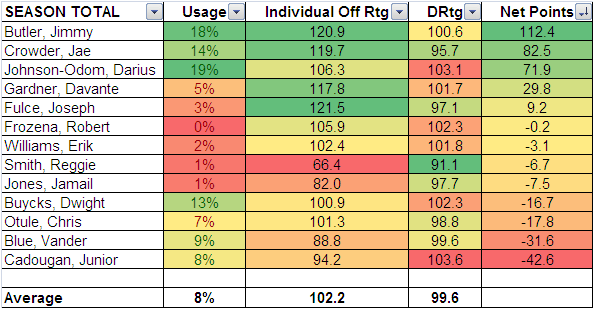
In conclusion, here's the entire collection put together in a summary, and sorted based on net points. As previously stated, it's just one way of looking at the relative contributions, and shouldn't be taken as gospel. Chances are, most people will cherry pick the data that reinforces their existing beliefs anyway. If they've read this far, that is.
However, I largely think this summary passes the red faced test. There is probably not much disputing the top three names on the list. Usage helps explain some of the middle names, and offensive rating provides much of the additional context. Where the complaints may come in is due to the defensive ratings and how those are sorted, and then implications on players that are rated as net-negative. Yet, not every player can be a net-positive player. If that were the case, MU would have lost far fewer than fifteen games last year.
Moving on from this set of numbers, the real question is how well players are going to continue to grow this upcoming year. Who will fill JFB's void? How much with Junior and Vander improve? To what extent will DJO and Crowder improve their efficiency and usage, respectively? Can Gardner move from a solid role player to a more featured member? All questions we're looking forward to getting answered.
Monday, August 01, 2011
2011 Net Points Contributions
Subscribe to:
Post Comments (Atom)

1 comment:
Cool.
Post a Comment