Marquette was the #12 overall seed when they reached the 2013 Elite Eight
Photo by Alex Brandon | AP Photo
Next week the NCAA Selection Committee will reveal their midseason top-16 seeds. The reveal is often considered a way for teams to gauge where they are at and for bracketologists to get an idea of how the Committee will approach Selection and Seeding. However we also hear about how in a single-elimination tournament, anything can happen and every team has a chance to win it all through their conference tournament and luck of the NCAA draw. Today, we will dig into the truth of that.
2012 was the first year the NCAA revealed their complete S-Curve. Cracked Sidewalks went back through every bracket since that reveal and pulled the data to see how far each of the protected seeds went. Past is not always a perfect predictor, but this might be worth bookmarking for March if you want an idea of how successful the various seeds are.

First, let's talk about what the table shows. Each seed is broken into four columns for the four exact seeds. So if we look at the first column, that represents the #1 overall seed, projected to be the favorite by the Selection Committee. The top line represents wins (see the leftmost column) by that exact seed, color coded so no shading represents an outcome that has never happened, lighter green shading representing fewer instances and darker shading representing more likely outcomes. The bottom shows the average number of wins per seed and the number of times that exact seed reached the Final Four (4 or more wins). With the data above, let's go seed by seed to see the best case scenario, worst case scenario, and expected results.
UConn captured the title as the #1 overall seed in 2024
Photo by Tyler Schank | NCAA Photos
1-Seeds
#1
Best Case: National Champions (2012 Kentucky, 2013 Louisville, 2024 Connecticut)
Worst Case: First Round loss (2018 Virginia)
Expectations: Half of all #1 seeds made the Final Four, with half of those winning it all. All but two made the second weekend, so if you are getting this seed, the expectation should be a second or third weekend run with odds as good as anyone of winning the title. 3.5 wins puts the average outcome between the Elite Eight and Final Four. Interestingly, this is the only exact seed that has had ever possible outcome, from zero wins to six.
#2
Best Case: National Champions (2018 Villanova, 2019 Virginia, 2021 Baylor)
Worst Case: Second Round loss (2015 Villanova)
Expectations: 33% of these teams reach the Final Four, but 92% made the second weekend, the highest rate of any exact seed. The #2 overall has been unlikely to be upset early and has also won the national title as often as any other seed. 3.42 wins puts the average outcome between the Elite Eight and Final Four, leaning slightly toward the former.
#3
Best Case: National Champions (2015 Duke, 2017 North Carolina, 2022 Kansas)
Worst Case: Second Round loss (2014 Wichita State, 2021 Illinois, 2023 Kansas)
Expectations: The #3 overall is less likely to go to the Final Four (42%) than the #1 but more likely to be a first weekend victim (25%) than the #2. 3.33 wins puts the average outcome between the Elite Eight and Final Four, leaning more likely to the former.
#4
Best Case: Runner-Up (2015 Wisconsin, 2017 Gonzaga)
Worst Case: First Round loss (2023 Purdue)
Expectations: This is the first notable expectation dropoff. Only 17% reach the Final Four, half as much as any other 1-Seed. 33% do not get out of the first weekend and the 2.33 wins on average puts the expected outcome between the Sweet Sixteen and Elite Eight with the former being more likely. Interestingly, when #4 seeds do get to the Final Four, they have always made the title game.
Kris Jenkins' buzzer beater won the title for #7 overall Villanova in 2016
Photo by Bob Donnan | USA Today
2-Seeds
#5
Best Case: Runner-Up (2012 Kansas)
Worst Case: First Round loss (2016 Michigan State)
Expectations: Considering this seed is the first team to not be a 1-Seed, it feels disappointing. No Final Four appearances since 2012, the fewest average wins of any 1/2-Seed and there are teams on the 3-Seed and 4-Seed lines that average more wins than the #5 overall. 1.92 average wins means the outcome is between one win and the Sweet Sixteen, with the latter far more likely.
#6
Best Case: Final Four (2016 Oklahoma, 2019 Michigan State)
Worst Case: First Round loss (2012 Duke, 2021 Ohio State, 2022 Kentucky)
Expectations: If the #6 can get out of the first round (three losses are the most for any 1/2-Seed) they will most likely go to the Elite Eight. Five times ending the season there is one of the highest prevalence outcomes. Despite that, the average win total of 2.25 (pulled down by the first round exits) puts them between the Sweet Sixteen and Elite Eight as the average finish, with the former more likely.
#7
Best Case: National Champions (2016 Villanova)
Worst Case: First Round loss (2013 Georgetown, 2023 Arizona)
Expectations: This is one of just three non-1-Seeds to win the title. This seed has a wide range of outcomes, and while the 2.25 win average puts them between the Sweet Sixteen and Elite Eight with the former more likely, having multiple outcomes of every possibility from a first round exit through the Final Four makes this one of the more unpredictable seeds.
#8
Best Case: Final Four (2014 Wisconsin, 2021 Houston, 2022 Duke)
Worst Case: First Round loss (2012 Missouri)
Expectations: The most frequent outcome is a second round loss, but when the #8 does get out of the first weekend, they make it to the Final Four half the time. The 2.00 average win total equates to a Sweet Sixteen expectation.
#10 overall seed Texas Tech came up short in 2019
Photo by Hannah Foslien | Getty Images
3-Seeds
#9
Best Case: Final Four (2017 Oregon)
Worst Case: First Round loss (2013 New Mexico, 2014 Duke, 2015 Iowa State, 2016 West Virginia)
Expectations: Like the #5 overall, the top 3-Seed is the least successful on its line. It stands out that this seed suffered four straight first round upsets followed by its only Final Four appearance. The four first round losses are tied for the most of any protected seed. By and large, this seed loses early. 67% of the time the #9 does not get out of the first weekend. 1.33 wins on average puts the expectation between one win and the Sweet Sixteen, with the former more likely.
#10
Best Case: Runner-Up (2019 Texas Tech)
Worst Case: First Round loss (2015 Baylor)
Expectations: While the highest frequency outcome is one win, this seed's outcomes are evenly split between a first weekend exit and making the Sweet Sixteen or better. 1.83 wins projects between one win and the Sweet 16, with the latter more likely.
#11
Best Case: Runner-Up (2018 Michigan)
Worst Case: First Round loss (2021 Texas, 2024 Kentucky)
Expectations: The Sweet Sixteen is the most frequent outcome, but they rarely go further than that (83% lose in the Sweet Sixteen or earlier). This is the seed that led to Shaka Smart leaving Texas for Marquette after the loss to Abilene Christian. 1.75 average wins puts most outcomes between the second round and Sweet 16, with the latter more likely.
#12
Best Case: Elite Eight (2013 Marquette, 2015 Notre Dame, 2018 Texas Tech, 2019 Purdue, 2024 Illinois)
Worst Case: Second Round loss (2012 Georgetown, 2021 Kansas)
Expectations: This has the narrowest range of outcomes, with every #12 seed winning between 1-3 games. 83% made the second weekend, but none went further. Because of the low volatility, the 2.25 average wins puts the expected outcome between the Sweet Sixteen and Elite Eight, with the former more likely. This seed has the best win average of any 3-Seed. Marquette checks in at #12 in today's S-Curve.
#13 overall UConn is the lowest protected seed to win a national title
Photo from Getty Images
4-Seeds
#13
Best Case: National Champions (2023 Connecticut)
Worst Case: First Round loss (2012 Michigan)
Expectations: This is the lowest protected seed to win it all, though 2014 7-Seed UConn won it from outside the protected seeds. While there's a wide outcome range, half of these teams saw their season end in the Sweet Sixteen, and the 2.33 average wins is the best exact seed outcome for any team outside the 1-Seed line. That win average leads to an expected finish between the Sweet Sixteen and Elite Eight, with the former more likely.
#14
Best Case: Elite Eight (2014 Michigan State, 2017 Florida)
Worst Case: First Round loss (2013 Kansas State, 2016 California, 2018 Wichita State, 2021 Purdue)
Expectations: This is the least successful protected seed. It is the only protected seed that has seen less than 50% of its teams reach the second weekend or beyond. The 1.25 win average puts the expectation between the second round and Sweet 16, with the former being more likely. The four first round losses are tied for the most of any protected seed.
#15
Best Case: Elite Eight (2015 Louisville)
Worst Case: First Round loss (2019 Kansas State, 2024 Auburn)
Expectations: This is the second least successful protected seed. It also has a narrow range of outcomes, with 75% of the teams winning 1-2 games. The 1.42 win average puts the expectation between the second round and Sweet 16, with the former being slightly more likely.
#16
Best Case: Final Four (2012 Louisville, 2024 Alabama)
Worst Case: First Round loss (2018 Arizona, 2021 Virginia, 2023 Virginia)
Expectations: The most frequent outcome is the Sweet 16, but there is a wide range of outcomes. The 2.00 win average puts the expectation at the Sweet 16.
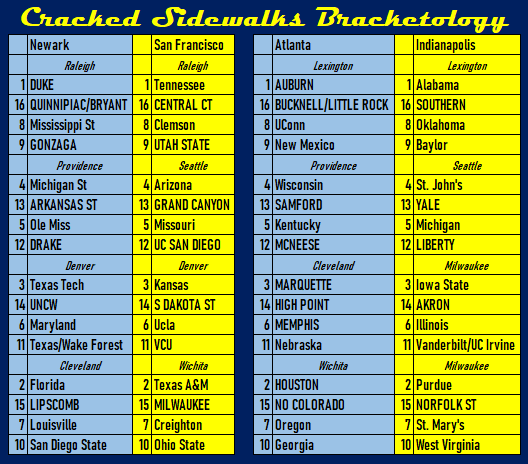
Here's the updated S-Curve and bracket:
Multibid Leagues
SEC: 13
Big 10: 10
Big 12: 7
Big East: 4
ACC:4
MWC: 3
Big West: 2
WCC: 2